Know what is covered
Group assets by site, room and rack. Distinguish normal readings from missing, stale and unavailable measurements.
- Explicit asset registration
- Site filters and paginated inventory
- Sample environment for evaluation
Organize sites and racks. Follow operational readings. See alerts and missing coverage in one workspace, with read-only host and targeted Redfish collectors.
Windows 10/11 x64 · Python included · Local operator preview
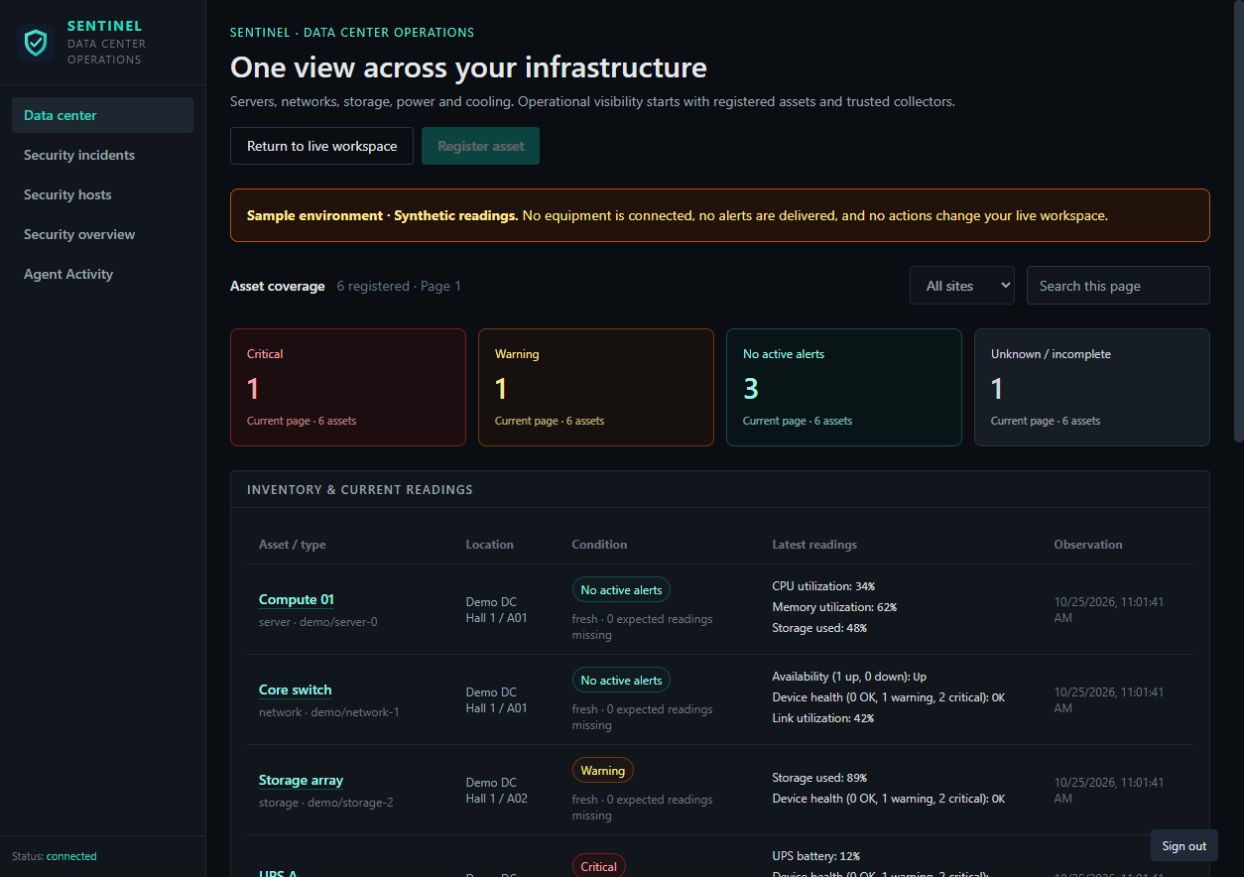
The foundation for mixed facilities: register equipment, connect a collector, and follow the measurements it actually provides.
Group assets by site, room and rack. Distinguish normal readings from missing, stale and unavailable measurements.
Review recent metric history and confirmed threshold transitions. Acknowledge an alert to record operator ownership.
Collect host CPU, RAM and system-volume usage, or configure a specific Redfish resource for supported hardware readings.
The Windows app opens in its own window and stores its preview workspace locally. Remote site collectors require a separately deployed HTTPS API and organization credentials.
See architecture and configuration →The Windows installer includes Python and adds Desktop and Start-menu shortcuts. WebView2 setup needs internet if it is missing. The app includes an explicit sample environment; live inventory starts empty.
Yes. The Windows installer includes the app's Python runtime. WebView2 is installed if missing. The separate collector ZIP needs Python and its pinned dependency; follow the setup guide before using it.
No. The Windows console's API binds to your own computer's loopback address. Remote collectors need a separately deployed, reachable HTTPS control plane, organization credentials and registered assets. Contact the project operator for access; private source access is needed for a self-hosted deployment.
Coverage begins with the assets and measurements you configure. Host collection covers CPU, RAM, the system volume and availability. Redfish reads an exact configured resource. Unavailable readings stay unknown. Network, hypervisor and building-management connectors are future work.
No autonomous data-center diagnosis or remediation is included in 0.5. Existing workstation support tools remain separate. Optional Muse requires explicit consent and provider access; this release did not validate provider quota or run paid inference.
This preview is for evaluation and complements your existing tools. It does not include an independent antivirus engine, production SLA or complete DCIM/NMS/BMS coverage. No subscription checkout has been added.
Try the sample environment or follow the collector setup guide. Tell us what worked, what blocked you, and which measurements or connections would make Sentinel useful in your daily operations.
Share preview feedback →GitHub account required · Feedback creates a public issue. Please leave out credentials, raw logs and private site details.
The Windows preview is free to download and evaluate. There is no subscription or checkout. Real-equipment monitoring needs a configured collector and separately deployed control plane.
This stage is about learning from operators and validating useful workflows. Future commercial plans will follow a defined, tested scope.